About web mapping
Even though first mapservers date back as far as 1993, their widespread usage became common around 2004/05 with the beginning of Open StreetMap and Google Maps. Since then technology evolved, more services launched and now various tools for producing web maps exist, most of them open source.
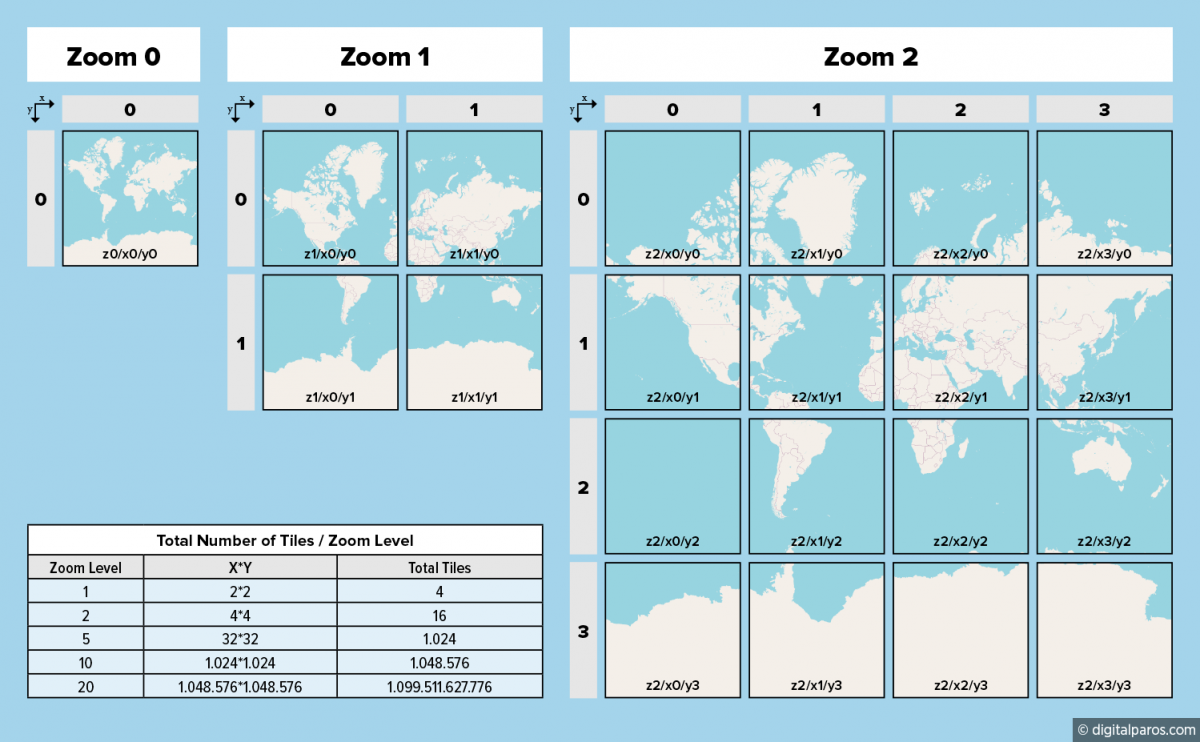
There are certain conventions that are used in online mapping, which split the world into tiles. At zoom level 0, the entire world fits into a single map tile. Each tile is replaced by 4 tiles at the subsequent zoom level. The numbering scheme for tiles varies but the OpenStreetMap scheme, also referred to as XYZ became de facto standard.
Definition of a tiled web map

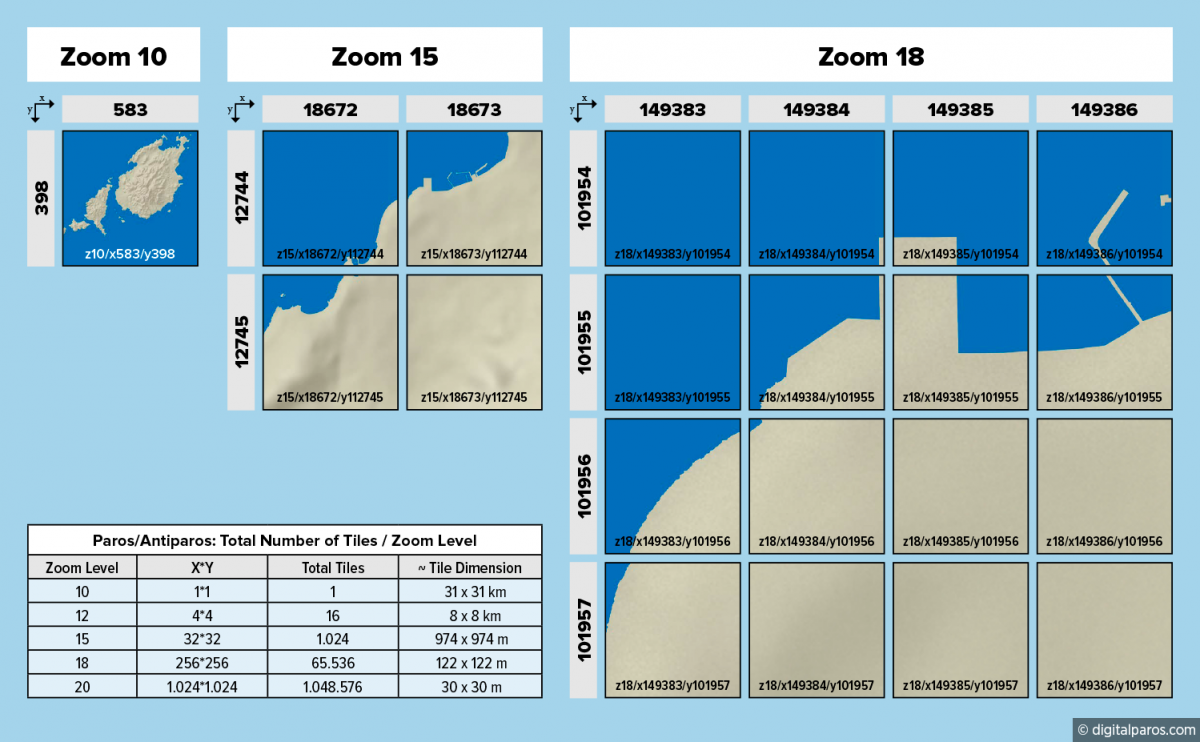
Each unique tile can be addressed by its zoom level, x and y value. At zoom level 10 the world is split into 1024x1024 tiles with the center tile (z10/x512/y512) spanning approximately 39x39km, whereas at zoom level 20 it's 1.048.576x1.048.576 tiles with the center tile (z20/x524288/y524288) at about 38x38m. Tiled web maps use the Web Mercator projection and as with most map representations of our spherical world, areas inflate with distance from the equator and so does each tile. The tile at zoom level 10 in the top left corner of the grid (z10/x0/y0) would only span just around 3x3km and at zoom level 20 (z20/x0/y0) 3x3m.
The web map of Paros

The Baselayer Map of Paros that I introduced in the last post fits almost entirely in one tile (z10/x583/y398). Fortunately the tiling of the original baselayer image can be automated but the process of tile generation consists basically of rescaling and cutting into pieces. At zoom level 18, the z10-area of that image is split into 65.536 tiles. For organizational and performance reasons these images get stored in a database, and that's what our mapserver is using as a source.

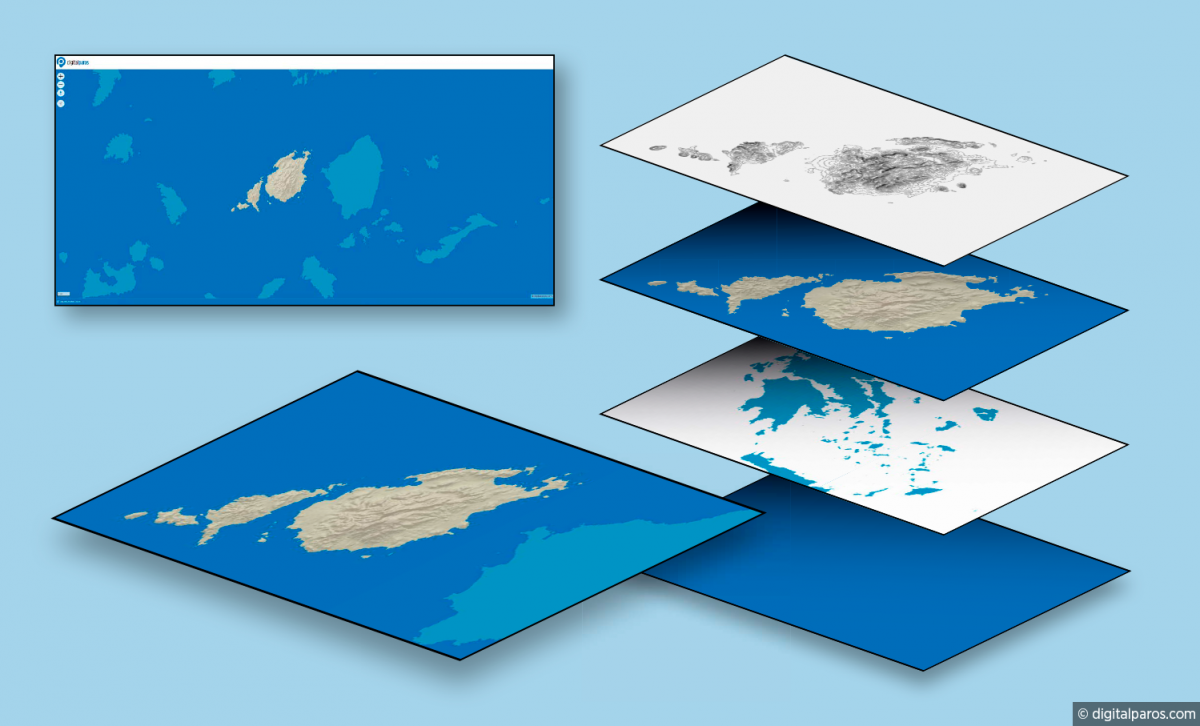
A single web map can consist of multiple layers, each can be fed from a different source. In my first demonstration, I added a vector tile layer of Greece coastlines and a vector tile layer of contour lines of Paros to complement the Paros baselayer. The result can be examined at our very first example-map.
The next step involves the addition of more detailed layers, which requires creation or aquisition of data to display. I will go into more detail about that in my next posts.